Data mash: it's the story that counts, not the numbers
Author: Ideas with Impact
Posted on Jun 17, 2016
Category: Faculty

A new MBA course offered this spring by Dr. Martin Wielemaker, a professor of entrepreneurship and strategic management with the faculty of business administration, embraced this philosophy The course, Infographics and Data Visualization, taught students how to explore data to see trends and opportunities, create actionable insights visually using Tableau software, and plan a strategy. The course ended with the Data Viz Challenge, a competition among the students working in teams, who were given three sets of open data from the City of Fredericton to analyze.
As a leader in open data, the City of Fredericton was keen to participate in the course. One week before the challenge the city provided the students data sets on the municipality’s water consumption, parking, and recreational facilities. A lot of people would find this information trivial, but the students scrutinized it from every angle and discovered interesting trends and stories that they turned into innovative recommendations for the city.
Turning data into stories
On the last day of class, the students pitched their insights and ideas to a panel of judges and members of the public at the Data Viz Challenge, held at Planet Hatch. Each team had five minutes to present and two minutes to answer questions.
According to Ed McGinley, the CEO of ImTech who emceed the event, the students “knocked it out of the park! The presentations were brilliant. They were informative, entertaining and most importantly - they caused everyone to think about things that are relatively mundane. Quite simply - they sparked conversations and prompted the audience to ask questions about why we consume water the way we do....why we park as we do and why we underuse the rec facilities. Then the conversations evolved around ‘how to we make it better?’"
Rob Lunn, GIS Coordinator with city thought the event “displayed the perfect synergy of open data / open government and smart people,” and admitted to being surprised by the level of the students’ insights, “Little did we, the audience and judging panel, realize the treat that was in store for us. In a short period of time (one week) the students took on the challenge of mashing together seemingly disparate datasets to present real world issues and offer some plausible solutions. Describing one of our datasets prior to the competition, a City staff member said: “I just don’t know if anyone would be interested in it. It may not be worth the effort.” By combining this “uninteresting” dataset with other data, the students gave eight amazing presentations, each looking at the data in a slightly different way. Let’s hope this is a start of further collaboration between the public sector, our educational institutions and our citizens!”
Real world experience in the classroom
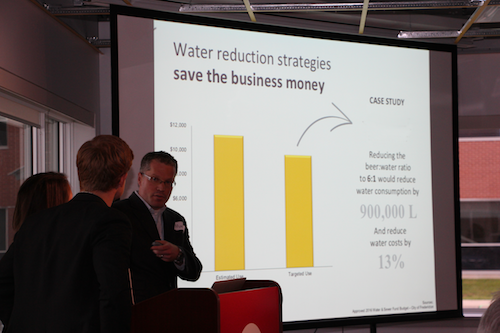
The first prize went to Leah Cain, Heidi Erdle and Eddie Kiiru for their presentation on the link between water use and property value in Fredericton; and the second prize went to Jessica Stutt, Mario Tiozzo and Scott Yorke for their presentation on water conservation illustrated by looking at the craft beer sector.
When asked about her experience in the course, Stutt said it “brought the real world to the classroom. The opportunity to work with actual data sets and to learn how to transform data into a story was a fantastic experience. It's something that I'll apply to my professional life on a daily basis.”
Having to compete on the last day of class might seem a little nerve wracking to some students, but according to Stutt it was nothing of the sort. “Pitching our work in a competition at Planet Hatch gave us the opportunity to bring the experience to life – it was amazing to see the different ways that teams transformed the data sets into meaningful stories with action items and takeaways.”
Making better decisions
The Infographics and Data Vizualization course is one of several that the faculty of business administration has introduced into the MBA program to prepare students for real world business challenges. “This course is addressing the need in the market place for professionals who are able to use data to make sound decisions for their businesses, organizations and communities,” said Wielemaker.
“We’re becoming very good at collecting data about the world around us, but it’s useless if we cannot explore it and gain insights from it that we can use to make smart decisions and act on. If we ignore the data available to us, we’re missing opportunities to improve and create better value for our customers and for society.”
Several members of the local business community supported the Data Viz Challenge, including Ignite Fredericton and Planet Hatch who provided the first prize and venue. The judges were Maurice Gallant, CIO of the City of Fredericton; Nick Scott, executive director of the New Brunswick Social Policy Research Network; and Dr. Emmanuel Stefanakis, associate professor of the department of Geodesy and Geomantics with UNB’s Faculty of Engineering. Along with Rob Lunn and Maurice Gallant, Valerie Kelly, IT manager with the City, also helped provide data sets to the students.
For more information contact Liz Lemon-Mitchell
Learn more about the Data Viz Challenge.
Learn more about our MBA program.
