COVID-19 modelling: the complex science of simple lines
Author: UNB Research
Posted on Oct 15, 2021
Category: Partnerships , Research , COVID-19
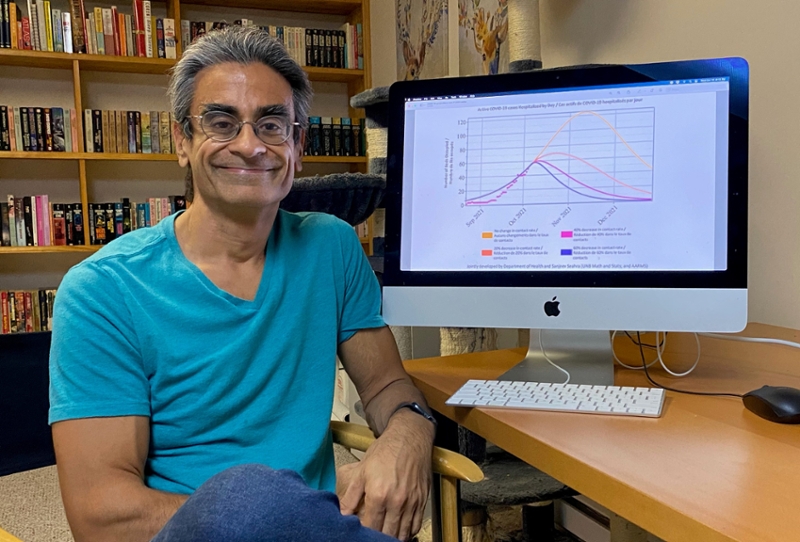
Four curves in four different colours: No change; reduction of contacts when compared to baseline (October 8, 2021) by 20%; by 40%; by 60%. Many New Brunswickers are likely familiar with this graph, which was shared with media on October 8, 2021.
It’s simple enough to understand the immediate implications: reducing our in-person contact will result in fewer hospitalizations, and less strain on our healthcare system.
But what goes into creating a graph like this?
Dr. Sanjeev Seahra (SS) is a professor of mathematics and statistics at UNB, director of the Atlantic Association for Research in the Mathematical Sciences, and one of the researchers involved in modelling the pandemic’s impact on Canada, and on New Brunswick. He’s one of the experts responsible for the model that was shared this past week.
Dr. James Watmough (JW) is also a professor of mathematics and statistics at UNB, co-director of the Canadian Centre for Disease Modelling, and he too has been involved in national modelling efforts.
They recently shared with us some of their knowledge and insight on the complex science behind simple lines:
How do disease modelling and mathematics fit together?
SS: Understanding how infectious diseases spread is an interdisciplinary effort: we need to bring together many different areas of expertise and knowledge to get the best picture we can.
Public health officials, epidemiologists, virologists and others are experts in determining the basic properties of a pathogen: how it’s transmitted, how it causes illness, how severe the illness is and the typical duration of each stage of the disease.
Mathematicians and statisticians have the important task of taking these insights and translating them into predictions of how a disease will spread through a population.
How do you create these models? Aren’t you essentially trying to predict the future?
SS: To start with, we assemble as much information as possible from scientific literature and media reports. This includes the length of time a person is ill from COVID-19, the efficacies of vaccines, the probability that a person who is ill will end up in hospital and other information that impacts the disease progression with the population.
This is used to create a mathematical model that predicts the spread of the disease, but leaves us with several unknown quantities such as the infectiousness (or basic reproduction number), the effectiveness of public health interventions like lockdowns, and the efficiency of testing programs in detecting mild or asymptomatic cases. We can estimate the values of these unknowns by comparing the results of our model to real-world data using various statistical techniques.
JW: We're not just trying to predict the future; we're trying to predict the past! For example, we might be interested in knowing how many unreported infections (the so-called asymptomatic cases) have already occurred. Answering questions like this turns out to be almost as difficult as predicting the future.
With so many unknowns, and new developments every day, how do you make your models as accurate as possible?
SS: We’re always trying to improve predictions by examining how the model has performed on past data and making changes accordingly. COVID-19 presents a rapidly changing landscape. We have new data constantly flowing for new cases, hospitalizations and vaccinations. As a result, we validate our key model parameters every day to generate fresh forecasts.
In addition, the rise of new variants has made us completely rebuild our models several times. Given the tsunami of data, the constantly changing nature of the disease and the fundamentally random nature of disease transmission, there is a limit on how accurate models can be.
What are some of the key patterns you’re looking for in your models?
SS: The most critical question for us is, how many COVID-19 cases and hospitalizations will we have in the future? We examine the data specifically with that question in mind.
One particularly important feature within this question is how new case counts respond to public health interventions. For example, how do case counts change when we move from household bubbles to our “Steady 20?” Whenever a new measure is announced, we’re paying close attention to the data to determine if the changes had the desired effect.
JW: At its heart, the model is built around the simple assumption that past cases and hospitalizations can predict future cases and hospitalizations. The simplest model would be to extend the case data in a straight line.
We try to improve on that by adding in the effects of things like increasing vaccination coverage and reductions in contact rates, but the linear forecasts are a good short-term approximation.
So, what kinds of questions can you answer through modelling?
SS: In recent work, we’ve been focusing on how changing what we’re calling the ‘contact rate’ affects the rate of spread of COVID-19.
Roughly speaking, the contact rate is the average number of people a typical member of the population sees everyday, multiplied by the probability that a single contact with a COVID-19 infected person will result in a new infection.
So, right now, we can answer questions like: if the contact rate decreases by 20%, how many new cases can we expect to see in a few weeks' time? This is what the graph shared by the Province is based on; once we have a prediction of how many cases there will be in the future, we can then predict how many people will be hospitalized, using knowledge of how the disease progresses from both clinical observations and statistical analyses.
It would be great to be able to build upon this to tie a specific type of public health intervention to a change in this contact rate. That is, we want to be able to answer questions like: how exactly do schools closing or staying open change the overall contact rate? This is a very active area of research right now, both here at UNB and at other institutions.
You mentioned gathering as much information as possible from literature and media; how challenging has it been to find the data you need?
SS: From a scientific perspective, one of the most interesting things to come out of this pandemic is the vast quantity of available open data. It is really easy to find publicly available data about almost every aspect of COVID-19. This is something quite new, and is certainly a result of us living in the age of “Big Data” and “Data Science.” Almost all the data that goes into our simulation are obtained from public sources, released by governments, agencies and researchers all over the world in an effort to help us overcome this pandemic as quickly as possible.
Has anything surprised you in your COVID-19 modelling work?
SS: The most surprising thing has been the pace of developments. Responding to COVID-19 has required a level of model-building agility that is completely unheard of in my other academic work. Most of my work is on general relativity and cosmology, and models of the early universe or black holes rarely need to be updated on a weekly or daily basis.
Nevertheless, this has certainly been a rewarding challenge. It has also been great to have this opportunity to work collaboratively with a broad range of experts from outside of mathematics, including many fantastic public health officials. These partnerships are not only crucial in understanding the disease, but pretty fulfilling in their own right. Ultimately, they provide a vivid example of how important mathematics and statistics are to everyday life.
Who are the collaborators and partners on this project?
Our research is part of a larger collaboration centered at UNB (Fredericton) involving the two of us, as well as Mathieu Chalifoux and Shannon LeBlanc (who is also a UNB alumna!), who are both epidemiologists with the Government of New Brunswick.
Bilal Husain and Gaia Noseworthy, two of our talented undergraduate students have contributed at various stages of the simulation development.
We’re all part of the Mathematics for Public Health initiative, a national network of COVID-19 researchers formed and funded by the Public Health Agency of Canada (PHAC) and the National Sciences and Engineering Research Council of Canada (NSERC). The New Brunswick Health Research Foundation (NBHRF) and the Canadian Institutes of Health Research (CIHR) have also provided much appreciated funding to enable our work.
Photo: Dr. Sanjeev Seahra with the COVID-19 graph recently shared by the Province of New Brunswick. Credit: Rowan Seahra
More information
Dr. Sanjeev Seahra (orcid)| Dr. James Watmough (orcid)| Department of Mathematics and Statistics | Faculty of Science
Atlantic Association for Research in the Mathematical Sciences| Mathematics for Public Health
Research at UNB | Graduate Studies at UNB | Postdoctoral fellowships